
S. Johnson1,2, A. Siddique2, K. Hyer3
1. Faculty of Kinesiology and Health Studies, Regina, SK, Canada; 2. Saskatchewan Population Health Evaluation Research Unit (SPHERU), University of Regina, Regina, SK, Canada; 3. Florida Policy Exchange Center on Aging, School of Aging Studies, University of South Florida, Tampa, FL, USA. Corresponding author: Dr. Shanthi Johnson, Faculty of Kinesiology and Health Studies, University of Regina, Regina, Saskatchewan, Canada
Jour Nursing Home Res 2017;3:88-98
Published online Octobre 10, 2017, http://dx.doi.org/10.14283/jnhrs.2017.14
Abstract
Background: Malnutrition is common among nursing home residents and it occurs when the nutrient intake is not sufficient, precipitated by a complex array of physiological, psychosocial and other factors. The importance of addressing malnutrition as early as possible in an efficient and effective manner has resulted in the development of several nutrition screening tools (NSTs) to identify those at risk for malnutrition. However, a recent systematic review of the NSTs concluded that «none performs better than «fair» in assessing nutritional status or in predicting outcomes.» Objectives: Thus, the purpose of this systematic review is to identify and review the indicators included in NSTs that identify malnutrition among LTC residents. Methods: For this systematic review, relevant publications were identified using a comprehensive search of electronic databases based on pre-established search criteria. A final list of 17 articles were reviewed and relevant data pertinent to the NSTs and the specific indicators used were extracted and entered into an excel spreadsheet for further analysis. The indicators were grouped as anthropometric measurements, biochemical, clinical factors, dietary assessment, psychological, social and physical factors, and then the individual indicators within each of the groupings were examined. Results: This paper shows that NSTs rely heavily on anthropometric measurements (93%) especially on body mass or weight based indicators (BMI, weight loss). Only 12% of NSTs include any biochemical indicator. Heavy reliance on certain indicators could compromise the effectiveness of NSTs in identifying individuals with malnutrition or in predicting outcomes. Conclusions NSTs, encompassing combinations of varied indicators, provides an alternate choice, however the optimal and best combination of these indicators has yet to be determined.
Key words: Nutrition screening, long term care, malnutrition.
Introduction
Malnutrition occurs when the nutrient intake is not sufficient. It is precipitated by a complex array of physiological, psychosocial and other factors and the elderly group and those in long term care (LTC) are particularly vulnerable. (1-7). The literature is rich in documenting the effects of malnutrition including risk of morbidity, extended hospital stays (8), loss of cognitive functions (9), lower wellbeing (9, 10) and mortality (1). A high prevalence of malnutrition in LTC residents is consistently reported in the literature (4, 11, 12). Estimates, using various methods, suggest that between 6 to 85 % residents of LTC are either at high risk for malnutrition or suffer from it (11-15). A multinational study, comprising of 4,507 LTC residents over age 65 from 12 countries representing all continents, reported that half were at risk and 14% were malnourished (3). Early identification of malnutrition in this age group outweighs the concomitant negative outcomes (4). Consequently, a number of nutrition screening tools (NSTs) have been developed to identify those at risk for malnutrition at earlier stages based on risk factors and/or indicators of malnutrition (16, 17).
A risk factor of malnutrition is an aspect or characteristic which can predispose an individual to malnutrition. Malnutrition risk or malnutrition could be ascribed to the presence of a single risk factor or combination of factors. A malnutrition indicator is a measureable parameter which provides evidence that malnutrition exists. Nutrition screening is a simple standardized method to detect malnourished individuals and/or at risk individuals that may need a further nutrition assessment (14). In the absence of a gold standard to determine malnutrition; nutritional risk or malnutrition is usually detected by indicators including Body Mass Index (BMI), weight loss and dietary intake (4, 18).
NSTs designed to assess nutritional status, are developed in the form of a questionnaire or checklist with the list of indicators related to malnutrition. Responses to these indicators are indicative of whether the individual is malnourished or at risk. Many NSTs exist in the literature, however there is no consensus on the effectiveness of NSTs specifically for LTC residents (13, 19). In 2013, Diekmann and colleagues (13) reported significant differences in the identification of malnutrition in LTC residents by examining three NSTs recommended by the European Society for Clinical Nutrition and Metabolism. The differences may be attributable to the indicators used in these NSTs and may under or overestimate residents as malnourished. In 2014, Van Bokhorst-de van der Schueren and colleagues (11) identified 18 NSTs which were used in the LTC setting and compared them with the rating of good, fair or poor based on the psychometric properties. They concluded that “none performs better than “fair” in assessing nutritional status or in predicting outcomes.” The importance of addressing malnutrition as early as possible in an efficient and effective manner requires the researchers and practitioners to step back and assess the indicators used in the NSTs. The purpose of this paper is to identify and review the indicators included in NSTs that identify malnutrition among LTC residents and critically examine the merits and limitations of indicators used in the NSTs to assess malnutrition among LTC residents.
Method
Search Strategy
Relevant publications for this review were identified using a systematic search of electronic databases, specifically Pub Med and CINAHIL using the following terms: nutritional status; under-nutrition; malnutrition; older people; elderly; long term care; nursing home; residential care homes; nutrition screening; nutritional screening tools. The searches were conducted from the earliest date available in the databases to November 2016. In addition, along with the retrospective searches of publications, the reference lists of the identified publications were reviewed to identify a comprehensive listing of articles. Inclusion and exclusion criteria for articles were defined based on the scope of the review and are described in Table 1.
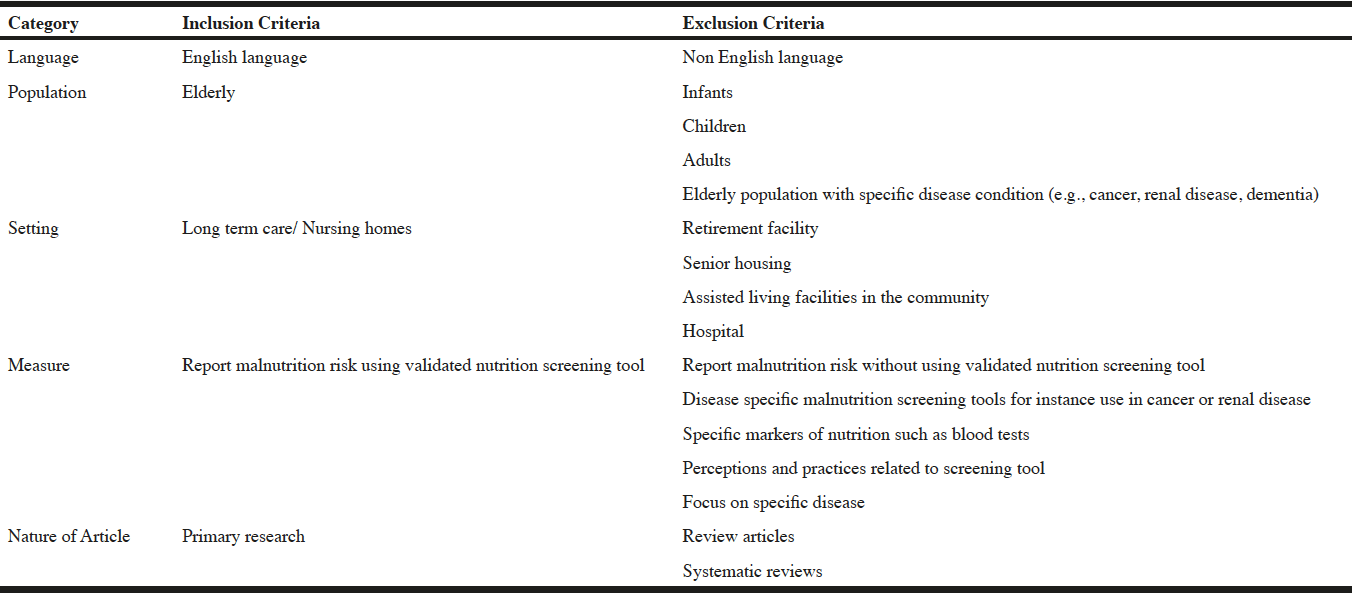
Table 1
Articles inclusion and exclusion criteria
Selection Process and Data Extraction
Articles obtained in the initial search (n=1319) were reviewed to make sure that they were consistent with the aim of the review; the articles which did not fit the aim were excluded. The full text of the remaining articles (n=19) was reviewed thoroughly and articles that did not match the pre-defined inclusion criteria were excluded (n=3). Figure 1 summarizes each step of the article selection process and shows the number of articles retrieved and excluded at each step. The final list of 17 articles and original studies (in which identified NSTs were developed) were reviewed and relevant data pertinent to the NSTs and the specific indicators used were extracted and entered into an excel spreadsheet for further analysis. The indicators were grouped as anthropometric measurements, biochemical, clinical factors, dietary assessment, psychological, social and physical factors. Individual indicators within each group were then examined.
Results
The systematic review resulted in the identification of 16 validated NSTs currently used in LTC settings developed from 1987 (SGA) to 2010 (SNAQ-RC – Dutch). As shown in Table 2, considerable variation is evident in the number and type of indicators used in the NSTs. In the first step, the indicators were grouped broadly as anthropometric measurements, biochemical, clinical, dietary assessment, psychological, social and physical indicators. Most tools used an amalgamation of different indicators. Except for SNAQ (US), all 15 out of 16 of the NSTs (94%) used anthropometric indicators. Few NSTs (2 out of 16 (12%)) included biochemical indicators. Some NSTs incorporated clinical indicators (9 out of 16 (56%)). Dietary indicators were assessed by 12 out of 16 NSTs (75%) and psychological, social and physical indicators were used by 7 out of 16 NSTs (44%).
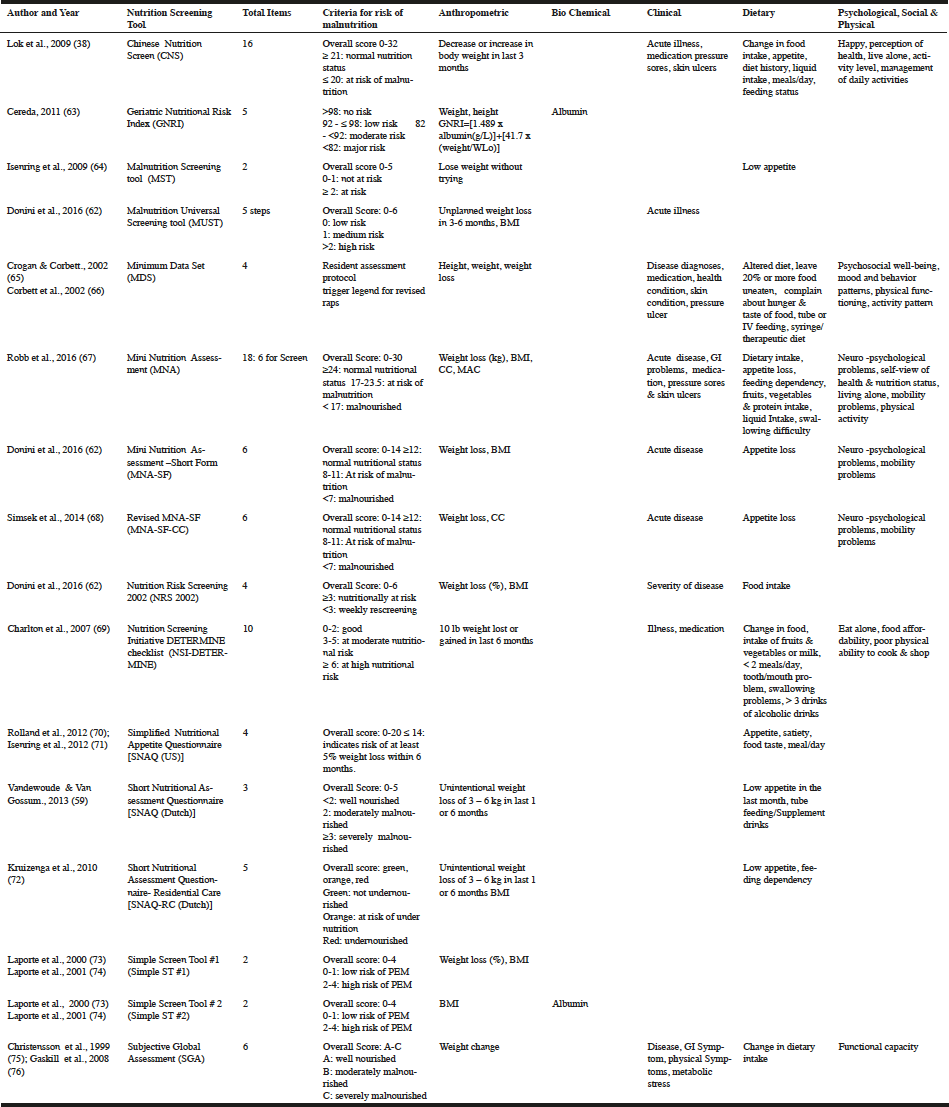
Table 2
Indicators used in NSTs to assess malnutrition among LTC residents (presented in alphabetical order of NSTs)
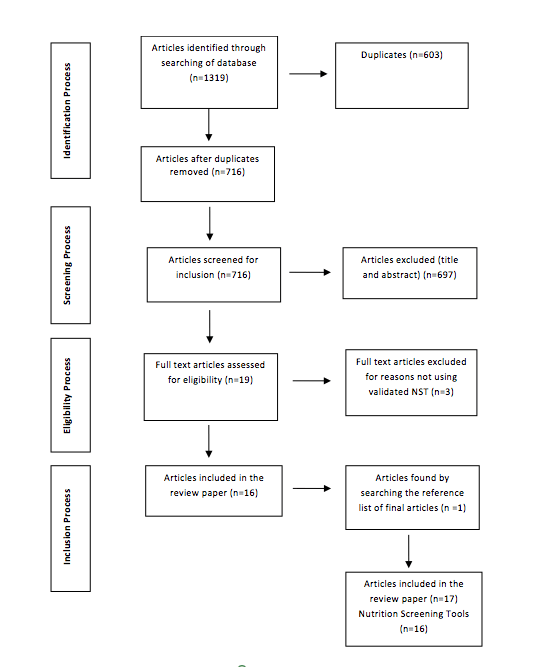
Figure 1
Flow chart summarizing the search process
Further analysis of the indicators within these groups revealed further variability not only in the specific indicators but also how they were measured. The specific indicators used in the NSTs to assess malnutrition in LTC residents are presented in Table 3. Anthropometric measurements are significant components of most NSTs. Weight loss is an important characteristic of NSTs and incorporated in 81% of NSTs. A wide variation in weight loss values, ranging from 1% to 10% between one week to six months, is evident as presented in Table 4. Four tools specifically asked whether the weight loss was unintentional. BMI is included in 44% of NSTs. BMI criteria and cutoff values to determine malnutrition differ among NSTs as shown in Table 5. Calf circumference (CC) is used by MNA-SF, whereas MNA incorporated both CC and mid arm circumference (MAC). Clinical indicators such as the presence of illness are used in 50% of NSTs and use of medication is included in 25% of NSTs. The least used indicator is the biochemical component with only 12% NSTs using this indicator (serum albumin being the most common).
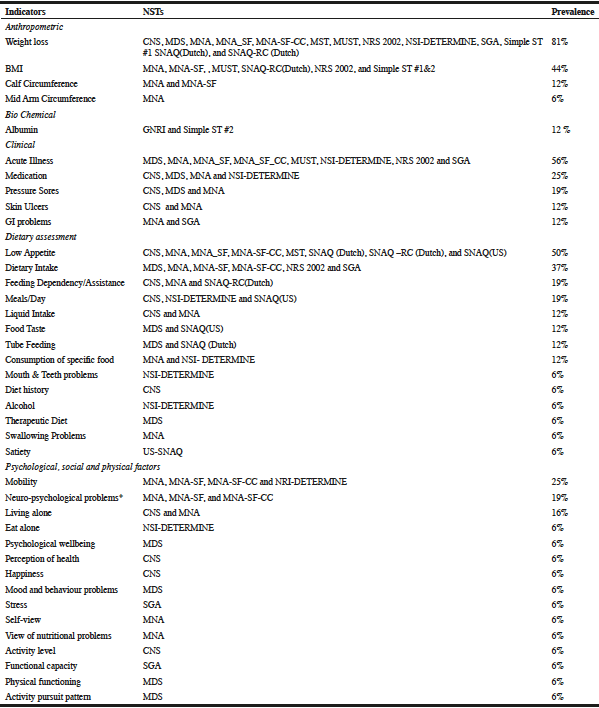
Table 3
Prevalence of indicators in NSTs used to assess malnutrition in LTC residents
Dietary assessment and related factors are part of many NSTs. Low appetite is integrated in 50% of NSTs. Overall dietary intake is included in 31% of NSTs. Some other features related to dietary assessment used in NSTs include consumption of specific foods (12%), use of therapeutic diet & supplements (12%), fluid intake (12%), tube/IV feeding (12%) and meals/day (31 %). Many factors, which hinder food intake including feeding dependency (19%), food taste (12%), mouth/teeth problems (6 %) and swallowing problem (6 %) are also incorporated in some of the NSTs.
Psychological, social and physical factors are also considered in a few NSTs as indicators, such as mobility (25%), neuro-psychological problems (19%) and living alone (16%). Other factors used in NSTs included eating alone (6%) psychological wellbeing (6%), perception of health (6%), happiness (6%), mood and behaviour problems (6%), and stress (6%). Some NSTs explored the physical functioning and activity levels through items such functional capacity (6%) and activity level (6%). Physical functioning and activity pursuit patterns are unique to MDS (6%). Only one NST (6%) NSI-DETERMINE incorporated financial status and consumption of alcohol as indicators of malnutrition.
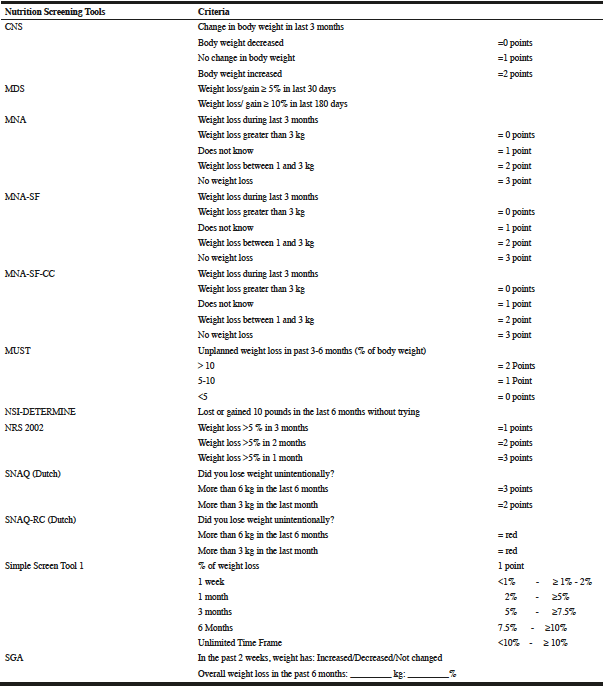
Table 4
Weight loss values in NSTs used to assess malnutrition in LTC residents
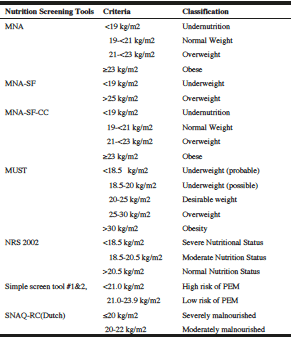
Table 5
BMI criteria and classification in NST used to assess malnutrition in LTC residents (presented in alphabetical order of NSTs)
Discussion
The purpose of this paper was to identify and review the indicators included in NSTs that assess malnutrition among LTC residents. In addition, the paper was to critically examine the merits and limitations of those indicators. The review identified 16 NSTs relevant to LTC residents. Given that the etiology of malnutrition is multi-factorial and screening the elderly is challenging, NSTs use different combinations of indicators to assess malnutrition. For the purpose of this review these indicators are grouped as anthropometric measurements, biochemical, clinical, dietary assessment and psychological, social & physical indicators.
The review indicates a heavy reliance on anthropometric measurements with weight loss and BMI the most commonly used measures in NSTs. Weight loss among the elderly is predominantly associated with risk of malnutrition (11, 12, 15, 18, 20-22). However, weight loss is problematic from a measurement perspective particularly with regards to LTC residents. Regular weight monitoring is difficult in bedridden LTC residents and most elderly are unable to recall their habitual weight (23). The loss in body weight could also be indicative of poor health status rather than exclusively nutrition as in the case of the effects of certain medications and/or chronic diseases. Additionally, hydration status could incorrectly increase or decrease weight. In the LTC population, heavy reliance on weight loss is not appropriate (24). Identifying and treating other factors which make a person susceptible to weight loss and malnutrition could be more effective. Furthermore, given the absence of significant weight loss definition, there is lack of consensus on standard weight loss cutoff values. Cutoff values ranging from 1-10% weight loss in previous one week to six months are reported in the literature (15, 25). The present review identified eight different definitions of weight loss.
BMI is a measure of body fat which is derived by dividing the body mass by the square of the body height. The unit of BMI is kg/m2. The purpose of attaining BMI is to categorize a person as underweight (BMI <18.5 kg/m2), normal weight (BMI18.5-25 kg/m2), overweight (25-30 kg/m2) or obese (>30 kg/m2) (26). BMI has been extensively used as a surrogate marker of malnutrition (15, 18, 20). However, there is an ongoing debate around whether it is a good indicator of malnutrition in the elderly or not (27, 28). A number of researchers considered BMI (sole marker) as a poor indicator of malnutrition risk in the elderly (15, 17, 18, 29, 30). Usually BMI is regarded as a measurement of fatness; conversely, it refers more to fat free mass (31). BMI is unable to take into account the changes occurring in the body composition as a result of aging (32-35). Age-related loss in lean body mass with the concomitant increase in fat mass has been well documented in the literature (1). Therefore, the same value of BMI in adults and the elderly indicates different body composition (36). In addition, height is a major component of BMI. However in the elderly, height decreases due to the vertebral compression, loss of muscle tone and other factors associated with aging (19). Incorrect measurement of height can lead to wrong BMI classification among LTC residents (37). Considering that presence of edema and dehydration can affect BMI reliability (38), other anthropometric measurements such as MAC and CC could be more accurate in estimating body muscle mass (39-41). The measures of MAC and CC are employed by many studies to measure fat stores and muscle mass. However, as with BMI, no universally accepted cutoff values of MAC or CC are available.
Another problematic issue with using BMI to determine malnutrition in elderly is that the literature is inconclusive about the best lower cutoff values particularly with reference to the elderly (15, 18, 40, 42, 43). The NSTs employed to determine malnutrition in LTC residents use different BMI cutoff values. Consequently, the variation in the reported prevalence rate of malnutrition in the elderly can be attributed to the different BMI cutoff value used to define malnutrition. The literature suggests the use of higher than normal reference values for the elderly (18, 44, 45). Normally used BMI range for adults (18.5-24.9 kg/m2) as established by World Health Organization is considered inappropriate for older adults (46). Until evidence-based and consistently accepted cutoff points are established, the BMI classification in elderly should be pursued with caution.
Acute illness and underlying disease is often associated with aging. Therefore, more than half of the NSTs include acute illness as an indicator of malnutrition. However, NSTs do not provide a description about the nature of acute illness, they are all treated equally. The NSTs should be more specific about the nature of acute illness. Chronic illness is more prevalent as compared to acute illness among LTC residents (15). Given that chronic illness causes malabsorption and affects metabolism, gastrointestinal problems are considered a risk factor contributing to the malnutrition in this population (17). Furthermore, aging itself is accompanied by changes in the gastrointestinal tract hence hindering absorption of many nutrients. Malabsorption problems such as diarrhea and vomiting can cause weight loss and subsequently malnutrition. Similarly, co-morbidities in the elderly require them to take excessive medication, which also exacerbates their nutrition status (47). Medication can induce dry mouth, anorexia and GI disturbances (nausea, constipation and diarrhea), and alter the nutritional status. Therefore, instead of relying only on acute illness, other clinical indicators should be considered and included in the NSTs.
Serum proteins (albumin, pre albumin, transferrin and retinol binding protein) produced by the liver have been used as indicators of nutrition status. NSTs show limited reliance on biochemical indicators. Only two NSTs incorporated biochemical indicators and both of them use albumin. Given that serum albumin predicts mortality and other complications, it is widely used in elderly (17). However, there is no consensus in the literature about the reliability of albumin as an indicator of malnutrition (39, 48). Infection and inflammation influence the level of serum albumins and minimize their effectiveness as an indicator of malnutrition (7, 23). Furthermore, hypo albumin is associated with the aging process (49). In 2011, Miyake and colleagues (50) reported increases in hypo albumin in the elderly over the age of 75. Instead of malnutrition, albumin is a good marker of inflammation (39), therefore one should not be evaluated for another. No serum protein solely works as a screening test, and should be used in combination with other malnutrition risk indicators (7).
As people grow older, appetite and food intake decreases (7), which, consequently affects their nutritional status (51). Low appetite is linked to malnutrition (22) and so many NSTs incorporated low appetite as an indicator of malnutrition. Inappropriate dietary intake is also associated with malnutrition in the elderly (18, 52). A comparison between recent intake and estimated requirement is another frequently used criterion to identify malnutrition. Dietary intake assessment in the elderly is a critical component, as there are many difficulties in estimating actual food intake. In addition, the nutrient requirements of very old are not explicitly defined (53). With regard to dietary assessment, it is evident that NSTs are too dependent on low appetite and dietary intake indicators while ignoring other indicators pertinent to LTC residents’ nutritional status. Chewing & swallowing problems and feeding dependency both significantly affect elderly food intake. Studies suggest an association between swallowing difficulty and malnutrition (54-56). LTC residents who can take food independently have less chance of becoming malnourished in comparison to those who depend on staff to feed them (15). To counteract the vicious circle of feeding dependency leading to reduced intake, weight loss and eventually malnutrition, sustained optimal feeding assistance is recommended (57). Indicators such as feeding dependency, chewing and swallowing problems should be included in NSTs in order to identify malnutrition in elderly at an early stage (4, 54, 55).
Accumulating evidence confirmed that many psychological, social and physical factors are considered as risk factors for malnutrition in the elderly particularly living in LTC. Depression is prevalent in LTC residents and associated with malnutrition (55). Depressed people normally consume less food and consequently may suffer from malnutrition (6). Living without family and friends is a contributing factor in the advancement of poor health in the elderly (51). Self –perception of health status is interpretive of the physical and health state of an aging body (58). Similarly, physical and functional capacity is considered as contributing factors to malnutrition in the elderly (18, 55, 59). Physical activity leads to good physical and psychological health (51). Conversely, low physical activity is related to poor health and reduced physical functioning (47, 60, 61). The aging process leads to changes in body composition, which might lead to a decrease in body functions. Consequently, impairment in activities of daily life (ADL) is associated with malnutrition (54, 56). Physical functions are also affected by LTC residents’ sedentary lifestyle and poor dietary habits. Regardless of these facts, few NSTs included psychological, social and physical indicators to assess malnutrition in the elderly. It appears that problems like weight loss and acute illness are more obvious therefore more consideration is given to them in the development of NST to identify malnutrition.
In an institutional context, there are additional factors associated with malnutrition. Recent studies have identified institutionalization itself as a risk factor of malnutrition among LTC residents (47, 54). It emphasizes a need to identify where, when and which conditions in the LTC environment accelerate malnutrition. Future research should focus on the role of organizational structure (size, profit & Staffing level), the care process (staff at mealtime, monitoring of weight) and outcome (malnutrition).
NSTs could be more precise in assessing malnutrition and malnutrition risk if they incorporate more indicators including biological, psychological and physical risks (11, 62). Although, NSTs incorporated varied combinations of different indicators, none of them performed better than ‘fair’ in assessing malnutrition (11). This emphasizes a need to give serious consideration to the indicators used in NSTs among LTC residents. Most of these NSTs are not specifically developed for LTC population therefore may not have fully considered the indicators more pertinent to LTC residents in identifying malnutrition. Excluding relevant indicators compromise the effectiveness of NSTs in determining malnutrition. These NSTs rely on anthropometric measurements; some of these indicators are difficult to apply on LTC residents. Although, weight loss, BMI and dietary intake are alarming signs of malnutrition, other risk factors which are equally pertinent to LTC residents’ nutritional status such as depression, functional status, chewing and swallowing problems should be included in NSTs for LTC residents (4, 54, 55). Furthermore, the absence of universally accepted reference values of indicators with reference to the elderly further limit their utility. The review calls attention to two main challenges. First, what is the optimal and best combination of indicators to assess malnutrition in LTC residents? Second, which are the best suitable cut off values for weight loss and BMI for LTC residents? These need further dialogue and research to improve on the current practice of screening for risk of malnutrition in the institutional context.
Conclusion
The review identified and summarized the indicators used in NSTs to assess malnutrition in LTC residents along with their merits and limitations. Due to its multi-factorial etiology, malnutrition cannot be diagnosed through a single measure. Therefore, use of a single measure to determine malnutrition is not sufficient/reliable. This paper showed that NSTs rely heavily on anthropometric measurements especially on body mass or weight based indicators (BMI, weight loss). Heavy reliance on certain indicators could compromise the effectiveness as a recent review showed none of the NST performed better than fair in identifying individuals with malnutrition or in predicting outcomes. NSTs, encompassing combinations of varied indicators, provides an alternate choice, however the optimal and best combination of these indicators has yet to be determined. To identify and address malnutrition in LTC residents, indicators which are more pertinent and indicative of malnutrition among LTC residents, at an earlier stage should be incorporated in NSTs. Further studies are also needed to examine the effectiveness of these tools in accurately identifying stages of malnutrition and in predicting outcomes.
Ethical Standards: Ethical standards for research were applied. Research ethics board approval was not required for this study.
Conflict of Interest: There is no conflict of interest.
References
1. Borgström Bolmsjö B, Jakobsson U, Mölstad S, Ostgren CJ, Midlöv P. The nutritional situation in Swedish nursing homes – A longitudinal study. Arch Gerontol Geriat 2015;60:128-133. doi: 10.1016/j.archger.2014.10.021
2. Törmä J, Winblad U, Cederholm T, Saletti A. Does undernutrition still prevail among nursing home residents? Clin Nutr 2013;32:562-568. doi: 10.1016/j.clnu.2012.10.007
3. Kaiser MJ, Bauer JM, Ramsch C, Uter W, Guigoz Y, Cederholm T, et al. Frequency of malnutrition in older adults: a multinational perspective using the mini nutritional assessment. J Am Geriatr Soc 2010;58:1734-1738. doi: 10.1111/j.1532-5415.2010.03016.x
4. Agarwal E, Marshall S, Miller M, Isenring E. Optimising nutrition in residential aged care: A narrative review. Maturitas 2016;92:70-78. doi: 10.1016/j.maturitas.2016.06.013
5. Geurden B, Franck E, Lopez Hartmann M, Weyler J, Ysebaert D. Prevalence of ‘being at risk of malnutrition’ and associated factors in adult patients receiving nursing care at home in Belgium. Int J Nurs Pract 2015;21:635–644. doi: 10.1111/ijn.12341
6. Tamura BK, Bell CL, Masaki KH, Amella EJ . Factors associated with weight loss, low BMI, and malnutrition among nursing home patients: A systematic review of the literature. J Am Med Dir Assoc 2013;14:649-655. doi: 10.1016/j.jamda.2013.02.022
7. Ahmed T, Haboubi N. Assessment and management of nutrition in older people and its importance to health. Clin Interv Aging 2010;5: 207-216. https://www.ncbi.nlm.nih.gov/pmc/articles/PMC2920201/
8. Pirlich M, Schutz T, Norman K, Gastell S, Lubke HJ, Bischoff SC, et al. The German hospital malnutrition study. Clin Nutr 2006;25:563-72. doi: 10.1016/j.clnu.2006.03.005
9. Olin AÖ, Koochek A, Ljungqvist O, Cederholm T. Nutritional status, wellbeing and functional ability in frail elderly service flat residents. Eur J Clin Nutr 2005;59:263-70. doi: 10.1038/sj.ejcn.1602067
10. Saletti A, Johansson L, Yifter-Lindgren E, Wissing U, Österberg K, Cederholm T. Nutritional status and a 3-year follow-up in elderly receiving support at home. Gerontology 2005;51:192-198. doi: 10.1159/000083993
11. Van Bokhorst-de van der Schueren MA, Guaitoli PR, Jansma EP, de Vet HC. A systematic review of malnutrition screening tools for the nursing home setting. J Am Med Dir Assoc 2014;15:171–84.
12. Bell CL, Tamura BK, Masaki KH, Amella EJ. Prevalence and measures of nutritional compromise among nursing home patients: weight loss, low body mass index, malnutrition, and feeding dependency, a systematic review of the literature. J Am Med Dir Assoc 2013;14: 94-100. doi: 10.1016/j.jamda.2012.10.012
13. Diekmann R, Winning K, Uter W, Kaiser MJ, Sieber CC, Volkert D, et al. Screening for malnutrition among nursing home residents – A comparative analysis of the mini nutritional assessment, the nutritional risk screening, and the malnutrition universal screening tool. J Nutr Health Aging 2013;17:326–331 http://dx.doi.org/10.1007/s12603-012-0396-2 Accessed Dec 12, 2016
14. Bauer JM, Kaiser MJ, Anthony P, Guigoz Y, Sieber CC. The Mini Nutritional Assessment®—its history, today’s practice, and future perspectives. Nutr Clin Pract 2008;23:388-396. doi: 10.1177/0884533608321132
15. Pauly L, Stehle P, Volkert D. Nutritional situation of elderly nursing home residents. Z Gerontol Geriatr 40:3-12. doi: 10.1007/s00391-007-0430-x
16. Hamirudin AH, Charlton K, Walton K. Outcomes related to nutrition screening in community living older adults: A systematic literature review. Arch Gerontol Geriatr 2016;62:9-25. doi: 10.1016/j.archger.2015.09.007.
17. Ji L, Meng H, Dong B. Factors associated with poor nutritional status among the oldest-old. Clin Nutr 2012;31:922-926. doi: 10.1016/j.clnu.2012.03.007
18. Stange I, Poeschl K, Stehle P, Sieber C, Volkert D. Screening for malnutrition in nursing home residents: Comparison of different risk markers and their association to functional impairment. J Nutr Health Aging 2013;17:357-363. doi: 10.1007/s12603-013-0021-z
19. Elia M, Stratton RJ. An analytical appraisal of nutrition screening tools supported by original data with particular reference to age. Nutrition 2012;28:477-94.doi: 10.1016/j.nut.2011.11.009
20. Salva A, Coll-Planas L, Bruce S, De Groot L, Andrieu S, Abellan G, Vellas B. Nutritional assessment of residents in long-term care facilities (LTCFs): Recommendations of the task force on nutrition and ageing of the IAGG European region and the IANA. J Nutr Health Aging 2009;13:475-483. doi: 10.1007/s12603-009-0097-7
21. Wilson MMG, Thomas DR, Rubenstein LZ, Chibnall JT, Anderson S, Baxi A, Diebold MR, Morley JE. Appetite assessment: simple appetite questionnaire predicts weight loss in community-dwelling adults and nursing home residents. Am J Clin Nutr 2005;82:1074-1081. http://ajcn.nutrition.org/content/82/5/1074.full
22. Kruizenga HM, Seidell JC, De Vet HCW, Wierdsma, NJ. Development and validation of a hospital screening tool for malnutrition: the short nutritional assessment questionnaire (SNAQ). Clin Nutr 2005;24:75-82. doi: 10.1016/j.clnu.2004.07.015
23. Bouillanne O, Morineau G, Dupont C, Coulombel I, Vincent JP, Nicolis I, Benazeth S, Cynober L, Aussel C. Geriatric Nutritional Risk Index: A new index for evaluating at-risk elderly medical patients. Am J Clin Nutr 2005;82:777-783. http://ajcn.nutrition.org/content/82/4/777.full
24. Ferrie S, Allman-Farinelli M. Commonly used “Nutrition” indicators do not predict outcome in the critically ill: A systematic review. Nutr Clin Pract 2013;28:463-484. doi:10.1177/0884533613486297
25. Wirth R, Streicher M, Smoliner C, Kolb C, Hiesmayr M, Thiem U, Sieber CC, Volkert D. The impact of weight loss and low BMI on mortality of nursing home residents – Results from the nutrition Day in nursing homes. Clin Nutr 2016;35:900-906. doi: 10.1016/j.clnu.2015.06.003
26. World Health Organization. Global database on body mass index. http://apps.who.int/bmi/index.jsp?introPage=intro3.html 2010. Accessed 13 October 2016
27. Bahat G, Tufan F, Saka B, Akin S, Ozkaya H, Yucel N, et al. Which body mass index is batter in the elderly for functional status? Arch Gerontol Geriatr 54: 2012;78-81. doi: 10.1016/j.archger.2011.04.019
28. Babiarczyk B, Turbiarz A. Body Mass Index in elderly people-do the reference ranges matter? Prog Health Sci.2012;2 : 58-67. http://progress.umb.edu.pl/sites/progress.umb.edu.pl/files/58-67%20Babiarczyk.pdf
29. Miranda D, Cardoso R, Gomes R, Guimarães I, de Abreu D, Godinho C et al. Undernutrition in institutionalized elderly patients with neurological diseases: comparison between different diagnostic criteria. Jour Nursing Home Res 2016;2:76-82. doi: 10.14283/jnhrs.2016.11
30. Seidell JC, Visscher TLS. Body weight and weight change and their health implications for elderly. Eur J Clin Nutr 2000;54:S33-S39. doi: 10.1038/sj.ejcn.1601023
31. Perissinotto E, Pisent C, Sergi G, Grigoletto F, Enzi G. Anthropometric measurements in the elderly: age and gender differences. Brit J Nutr 2002;87:177–186. doi: 10.1079/BJN2001487
32. Chang MY, Chen HY. Body composition outcomes of a Qigong intervention among community-dwelling aging adults. Western J Nurs Res 2016;38:1574-1594. doi: 10.1177/0193945916654907
33. Gába A, Přidalová M. Age-related changes in body composition in a sample of Czech women aged 18-89 years: A cross-sectional study. Eur J Nutr 2014;53:167-176. doi: 10.1007/s00394-013-0514-x
34. Bhurosy T, Jeewon R. Pitfalls of using body mass index (BMI) in assessment of obesity risk. Curr Res Nutr Food Sci 2013;1:71-76. doi: 10.12944/CRNFSJ.1.1.07
35. Chang SH, Beason TS, Hunleth JM, Colditz GA. A systematic review of body fat distribution and mortality in older people. Maturitas 2012;72:175-191. doi: 10.1016/j.maturitas.04.004
36. Hu H, Li Z, Yan J, Wang X, Xiao H, Duan J, Zheng L. Anthropometric measurement of the Chinese elderly living in the Beijing area. Int J Ind Ergonom 2007;37:303-311. doi: 10.1016/j.ergon.2006.11.006
37. Gavriilidou NN, Pihlsgard M, Elmstahl S. High degree of BMI misclassification of malnutrition among Swedish elderly population: Age-adjusted height estimation using knee height and demispan. Eur J Clin Nutr 2015;69:565-571. doi: 10.1038/ejcn.2014.183
38. Lok K, Woo J, Hui E, Kwok T. Usefulness of the Chinese Nutrition Screening (CNS) tool in predicting 12 month mortality in elderly Hong Kong Chinese living in institutions. J Nutr Health Aging 2009;13:96-101. doi: 10.1007/s12603-009-0014-0
39. Bharadwaj S, Ginoya S, Tandon P, Gohel TD, Guirguis J, Vallabh H, Jevenn A, Hanouneh I. Malnutrition: laboratory markers vs nutritional assessment. Gastroenterol Rep 2016;4:1-9. doi: 10.1093/gastro/gow013
40. López-Contreras MJ, Torralba C, Zamora S, Pérez-Llamas F. Nutrition and prevalence of undernutrition assessed by different diagnostic criteria in nursing homes for elderly people. J Hum Nutr Diet 2012;25:239–246. doi: 10.1111/j.1365-277X.2012.01237
41. Kaiser M, Bauer JM, Ramsch C, Uter W, Guigoz Y, Cederholm T et al. Validation of the Mini Nutritional Assessment Short-Form (MNA®-SF): A practical tool for identification of nutritional status. J Nutr Health Aging 2009;13:782-788. doi: 10.1007/s12603-009-0214-7
42. Power SE, Jeffery IB, Ross RP, Stanton C, O’Toole PW, O’Connor EM, Fitzgerald GF. Food and nutrient intake of Irish community-dwelling elderly subjects: Who is at nutritional risk? J Nutr Health Aging 2014;18:561-572. doi:10.1007/s12603-014-0449-9
43. de Hollander E, Van Zutphen M, Bogers RP, Bemelmans WJ, De Groot LC. The impact of body mass index in old age on cause-specific mortality. J Nutr Health Aging 2012;16:100-106. doi: 10.1007/s12603-011-0077-6
44. Sanz París A, García JM, Gómez-Candela C, Burgos R, Martín Á, Matía P. Malnutrition prevalence in hospitalized elderly diabetic patients. Nutr Hosp 2013;28:592-599. doi: 10.3305/nh.2013.28.3.6472
45. Stevens J. Impact of age on associations between weight and mortality. Nutr Rev 2000;58:129-37. doi: 10.1111/j.1753-4887.2000.tb01847.x
46. Winter J, MacInnis R, Wattanapenpaiboon N, Nowson C. BMI and all-cause mortality in older adults: A meta-analysis. Am J Clin Nutr 2014;99:875-890. doi:10.3945/ajcn.113.068122
47. Singh DR, Shrestha S. Nutritional status of senior citizens living in old age homes of Kathmandu metropolitan municipality. Int J Community Med Public Health 2016;3:1707-1715. doi: 10.18203/2394-6040.ijcmph20162032
48. White JV, Guenter P, Jensen G, Malone A, Schofield M. Academy malnutrition work Group; ASPEN Malnutrition task force; ASPEN Board of Directors. Consensus statement: Academy of Nutrition and Dietetics and American Society for Parenteral and Enteral Nutrition: Characteristics recommended for the identification and documentation of adult malnutrition (undernutrition). JPEN J Parenter Enteral Nutr2012;36:275-283.
49. Brock F, Bettinelli LA, Dobner T, Stobbe JC, Pomatti G, Telles, CT. Prevalence of hypoalbuminemia and nutritional issues in hospitalized elders. Rev Lat-Am Enferm. 2016;24. doi: 10.1590/1518-8345.0260.2736
50. Miyake M, Ogawa Y, Yoshida Y, Imaki M. Seven-year large cohort study for the association of serum albumin level and aging among community dwelling elderly. J Anal Bio-Sci 2011;34:281-286 http://j-jabs.umin.jp/34/34.281.pdf
51. Amarya S, Singh K, Sabharwal M. Changes during aging and their association with malnutrition. J Clin Gerontol Geriatr 6:78–84. doi: 10.1016/j.jcgg.2015.05.003
52. Van Damme N, Buijck B, Van Hecke A, Verhaeghe S, Goossens E, Beeckman D. Development of a quality of meals and meal service set of indicators for residential facilities for elderly. J Nutr Health Aging 2016;20: 471. doi: 10.1007/s12603-015-0627-4
53. Malavolta M, Mocchegiani E. In _____(eds) Molecular Basis of Nutrition and Aging: A Volume in the Molecular Nutrition Series. Academic Press. pp 724, 2016
54. Fávaro-Moreira NC, Krausch-Hofmann S, Matthys C, Vereecken C, Vanhauwaert E, Declercq A, Bekkering GE, Duyck J. Risk factors for malnutrition in older adults: A systematic review of the literature based on longitudinal data. Adv Nutr: An International Review Journal 2016;7:507-522. doi: 10.3945/an.115.011254
55. Bell CL, Lee AS, Tamura, BK. Malnutrition in the nursing home. Curr Opin Clin Nutr Metab Care 2015;18:17-23. doi:10.1097/MCO.0000000000000130
56. Suominen M, Muurinen S, Routasalo P, Soini H, Suur-Uski I, Peiponen A, Finne-Soveri H, Pitkala KH. Malnutrition and associated factors among aged residents in all nursing homes in Helsinki. Eur J Clin Nutr 2005;59:578-583. doi: 10.1038/sj.ejcn.1602111
57. Pedersen PU, Kuosma K, Hundrup YA . Mealtime assistance and identification of eating difficulties prevent unintended weight loss in nursing home residents – A controlled trial. J Nurs Educ Pract 2014;4:33-42. doi:10.5430/jnep.v4n11p33
58. Ocampo, JM. Self-rated health: importance of use in elderly adults. Colomb Medica 2010;41:275-289. doi:
59. Vandewoude M, Van Gossum A. Nutritional screening strategy in nonagenarians: the value of the MNA-SF (mini nutritional assessment short form) in NutriAction. J Nutr Health Aging 2013;17:310-314. doi: 10.1007/s12603-013-0033-8
60. Chastin SFM, Fitzpatrick N, Andrews M, DiCroce N. Determinants of sedentary behavior, motivation, barriers and strategies to reduce sitting time in older women: A qualitative investigation. Int J Env Res Pub He 2014;11:773-791. doi: 10.3390/ijerph110100773
61. Chastin SFM, Buck C, Freiberger E, Murphy M, Brug J, Cardon G, O’Donoghue G, Pigeot I, Oppert JM. Systematic literature review of determinants of sedentary behaviour in older adults: A DEDIPAC study. Int J Behav Nutr Phy 2015;12: 127. doi:10.1186/s12966-015-0292-3
62. Donini LM, Poggiogalle E, Molfino A, Rosano A, Lenzi A, Fanelli FR, Muscaritoli M. Mini-Nutritional Assessment, Malnutrition Universal Screening Tool, and Nutrition Risk Screening Tool for the Nutritional Evaluation of Older Nursing Home Residents. J Am Med Dir Assoc 2016;17:959.e11- 959.e18 doi: 10.1016/j.jamda.2016.06.028
63. Cereda E, Pedrolli C, Zagami A, Vanotti A, Piffer S, Opizzi A, et al. Nutritional screening and mortality in newly institutionalised elderly: A comparison between the geriatric nutritional risk index and the mini nutritional assessment. Clin Nutr 2011;30:793-798.doi: 10.1016/j.clnu.2011.04.006
64. Isenring, E. A., Bauer, J. D., Banks, M., & Gaskill, D. The Malnutrition Screening Tool is a useful tool for identifying malnutrition risk in residential aged care. J Hum Nutr Diet 2009;22:545-550.doi: 10.1111/j.1365-277X.2009.01008.x
65. Crogan NL, Corbett CF. Predicting malnutrition in nursing home residents using the minimum data set. Geriatr Nurs 2002;23:224-226.doi: 10.1067/mgn.2002.126972
66. Corbett CF, Crogan NL, Short RA. Using the Minimum Data Set to predict weight loss in nursing home residents. Appl Nurs Res 2002;15:249-253. doi: 10.1053/apnr.2002.35947
67. Robb L, Walsh CM, Nel M, Nel A, Odendaal H, van Aardt R. Malnutrition in the elderly residing in long-term care facilities: a cross sectional survey using the Mini Nutritional Assessment (MNA®) screening tool. South Afr Clin Nutr 2016;1-7. doi: 10.1080/16070658.2016.1248062
68. Simsek H, Sahin S, Ucku R, Sieber CC, Meseri R, Tosun P, Akcicek, F. The diagnostic accuracy of the revised mini nutritional assessment short form for older people living in the community and in nursing homes. J Nutr Health Aging 2014;18:725-729. doi: 10.1007/s12603-014-0536-y
69. Charlton KE, Kolbe-Alexander TL, Nel JH. The MNA, but not the DETERMINE, screening tool is a valid indicator of nutritional status in elderly Africans. Nutrition. 2007;23:533-542.doi: 10.1016/j.nut.2007.04.015
70. Rolland Y, Perrin A, Gardette V, Filhol N, Vellas B. Screening older people at risk of malnutrition or malnourished using the Simplified Nutritional Appetite Questionnaire (SNAQ): A comparison with the Mini-Nutritional Assessment (MNA) tool. J Am Med Dir Assoc 2012;13:31-34. doi: 10.1016/j.jamda.2011.05.003
71. Isenring EA, Banks M, Ferguson M, Bauer, JD. Beyond malnutrition screening: appropriate methods to guide nutrition care for aged care residents. J Acad Nutr Diet 2012;112:376-381.doi: 10.1016/j.jada.2011.09.038.
72. Kruizenga HM, De Vet HCW, Van Marissing CME, Stassen EEPM, Strijk JE, Van Bokhorst-De Van Der MAE, Horman JCH, Schols JMGA, Van Binsbergen JJ, Eliens A, Knol, DL. The SNAQrc, an easy traffic light system as a first step in the recognition of undernutrition in residential care. J Nutr Health Aging 2010;14:83-89. doi: 10.1007/s12603-009-0147-1
73. Laporte M, Villalon L, Payette H. Simple nutrition screening tools for healthcare facilities: development and validity assessment. Can J Diet Pract Res 2001a;62:26-34. https://www.ncbi.nlm.nih.gov/pubmed/11518553
74. Laporte M, Villalon L, Thibodeau J, Payette H. Validity and reliability of simple nutrition screening tools adapted to the elderly population in healthcare facilities. J Nutr Health Aging 2001b;5:292-294. https://www.ncbi.nlm.nih.gov/pubmed/11753498
75. Christensson L, Unosson M, Ek AC. Evaluation of nutritional assessment techniques in elderly people newly admitted to municipal care. Eur Clin Nutr 2002;56:810-818. doi: 10.1038=sj.ejcn.1601394
76. Gaskill D, Black LJ, Isenring EA, Hassall S, Sanders F, Bauer, JD. Malnutrition prevalence and nutrition issues in residential aged care facilities. Australas J Ageing. 2008;27:189-194.doi: 10.1111/j.1741-6612.2008.00324.x