
C. Lannering1,2,3, L. Johansson1,2,4, M. Ernsth Bravell1,2
1. School of Health and Welfare, Institute of Gerontology, Jönköping University, Jönköping, Sweden; 2. Ageing Research Network-Jönköping, Jönköping University, Jönköping, Sweden; 3. Region Jönköping County, Futurum, Länssjukhuset Ryhov, Jönköping, Sweden; 4. School of Health and Welfare, Department of Nursing, Jönköping University, Jönköping, Sweden Corresponding author: Christina Lannering, School of Health and Welfare, Institute of Gerontology, Jönköping University, Jönköping, Sweden, Christina.lannering@rjl.se
Jour Nursing Home Res 2017;3:64-70
Published online May 5, 2017, http://dx.doi.org/10.14283/jnhrs.2017.11
Abstract
Objective: Malnutrition with consequent weight loss is a well-known problem among older frail persons living in nursing homes. The objective of this study was to examine the effect of a structured preventive care programme including an individualized nutrition plan. Design: A retrospective study, based on already collected data from two different nursing home populations. One population constituted a group of nursing home residents receiving the nutritional care programme (ncp-group), including individually performed nutritions actions. The ncp-group (N=135) was registered in the national quality registry Senior Alert (SA), a platform for following of this preventive care process. The other population constituted a group of nursing home residents receiving “care as usual” (n=186), ie not using the nutritional care programme, collected from the study SHADES. The two populations was compared by a quasi-experimental pre-posttest design with a follow-up time of 5–7 months. Settings: Nursing homes in Sweden. Participants: Two populations of nursing home residents assessed to be at risk for malnutrition, or to be already malnourished, according to the short form of the Mini Nutritional Assessment (MNA-SF). Intervention: The ncp-group received a structured, individually targeted care programme including risk assessments, team-based decisions on actions, and evaluation of results. Measurements: Body weight and weight changes were monitored over time. Additionally, nutritional status was described using the MNA-SF scores and body mass index (BMI). Results: No statistically significant differences in body weight, MNA-SF or BMI between the groups were found at follow-up. However, within-group analyses in the group followed in SA showed improved outcomes. Conclusion: This suggest small differences in nutritional care provided at nursing homes working with SA and “care as usual” in nursing homes, not working with SA.
Key words: Nursing home, malnutrition, Senior Alert, BMI, Intervention.
Background
Malnutrition and unintentional weight loss are well-known problems among old frail persons living in nursing homes (1–3). Malnutrition begins when food and nutrient intake is consistently inadequate to meet the individual’s nutrient requirements (4). The consequences of malnutrition are widely documented and include immune dysfunction, reduced muscle function, delayed wound healing, prolonged hospitalization and increased mortality (5).
Risk factors for malnutrition among older people can be divided into three main types: medical, social and psychological. Medical risk factors include poor appetite, loss of taste and smell, gastrointestinal disorders, poor oral health and endocrine disorders, while isolation and loneliness, and inability to shop or prepare food are among the social risk factors. Psychological risk factors include confusion, dementia and depression (6–8). Since nutritional status depends on many different factors, more than one parameter is needed to identify malnutrition. Therefore, screening tools have been developed to assess nutritional status, taking several aspects simultaneously into account (9). Several studies in nursing home populations, based on risk screening tools, have shown both high risk and high prevalence of malnutrition. Elsewhere, a risk prevalence of 40–60% has been reported (10–13), which reflects the vulnerability of this group of older persons.
Previous intervention studies, with the intention to improve nutritional status among older persons in nursing homes, have mostly examined the effects of oral nutritional supplements such as energy-boosting/protein-enriched meals or nutrient-enriched drinks. Randomized controlled studies have shown both improvement (14, 15) as well as no effect regarding weight change (16-18). Wikby et al. (19) report on a nutritional programme that also included education provided to staff, regarding nutritional needs and individualized nutritional care. No statistically significant differences between the experimental group and the control group were found but some improvements were seen within the experimental group (ibid).
Earlier reports indicates that risk assessment should be followed by a detailed analysis of causes (20), and have emphasized the usefulness of individually tailored nutritional interventions (9, 14, 19). As nutrition supplements represents only one element of a complex array of interactions that may affect a person’s nutritional status, even more individually adjusted interventions are probably needed.
In 2010 the Government Offices of Sweden emphasized the need for improving care for frail older persons (21, 22) and it was decided that the web-based national quality register Senior Alert (SA) should be used countrywide. The intention was to support caregivers in offering preventive care according to the best available clinical knowledge and evidence by providing a computerized system with tools, information and guidance. Persons over 65 years seeking care or already in the care system were targeted for registration with SA, which covers several risk areas including malnutrition. Use of a systematic workflow including risk assessments, team-based decisions on actions, measurement of outcomes and evaluation of results (23) should improve the quality of care. Although the register has been used across Sweden for several years, no academic articles reporting outcomes in a nursing home population have been published. The aim of this study was to examine whether a structured preventive care process as outlined within the programme of SA result in improved nutritional status, measured by body weight, BMI and MNA-SF, compared with “care as usual”.
Method
Design and setting
This study is based on already collected data. The participants were nursing home residents assessed as at risk of malnutrition, or as already malnourished, according to the short form of the Mini Nutritional Assessment (MNA-SF). One group included participants that were registered with SA and received nutritional interventions according to the assessed needs. The other group, used as a control group, received “care as usual” at nursing homes not using SA. The two groups were compared using a quasi-experimental, pretest-posttest design with 5–7 months’ follow-up. Hereafter the group receiving the structured nutritional care programme in SA is called ncp-group and the other group is called control-group.
This present study is part of a larger project “Health Development in Late Life” where data from a set of National Quality registers were individually matched to an older twin population in the Swedish Twin Registry; the SALT (Screening Across the Lifespan) population (24). The aim of the larger project is to understand health and health factors in old age. From the SALT population it was 5,255 persons who were recorded in SA from which 1,542 persons were living in nursing homes, aged over 65 and assessed with MNA-SF. Of these, 135 were eligible for inclusion into the ncp-group, i.e. at risk of malnutrition, or already malnourished at first registration in SA and with a possible follow-up time at 5-7 months (Figure 1). We also used matched data from the Social Services registry to get information on date of admission to nursing homes for the participants in the ncp-group. Given that no pair of twins was included into this group this population was considered a “normal” population. Senior Alert is used countrywide and members of this group were spread over 124 nursing home wards.
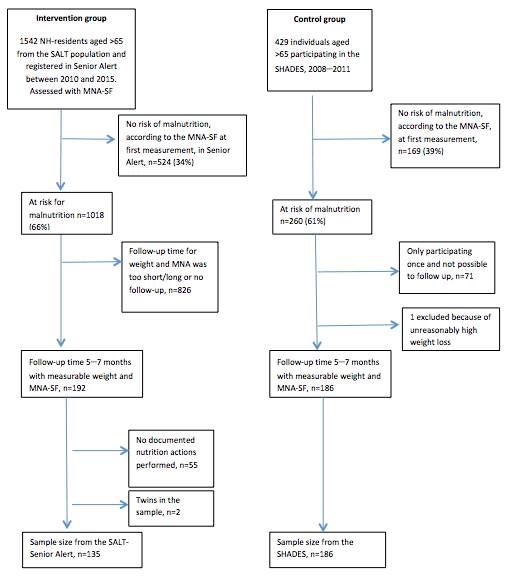
Figure 1
Inclusion flow diagram showing inclusion to the two groups
MNA = Mini Nutritional Assessment; MNA-SF = short form of the Mini Nutritional Assessment; SALT = Screening Across the Lifespan study; SHADES = Study of Health and Drugs among the Elderly in Swedish nursing homes.
The control-group was selected from the Study of Health and Drugs among the Elderly in Swedish nursing homes (SHADES) population, which is described elsewhere (25, 26). A total of 429 persons were included in the SHADES, which collected different kinds of data including risk assessments for malnutrition. Besides baseline measurements, five follow-ups were performed, with approximately 6 months between them. The SHADES covered twelve nursing homes (43 wards) in three different regions in Sweden. None of these nursing homes was using SA or participating in any project aimed at improving nutritional status. A total of 186 participants from the SHADES population met the criteria, and was included into the control-group (Figure 1).
In the control-group, 41% had been at the nursing home for less than 6 months. For the ncp-group, the corresponding percentage was 46%; however, because of incomplete data in the Social Services registry, time could not be calculated for 28% of the cases in the ncp-group. Table 1 shows descriptive data for both groups.
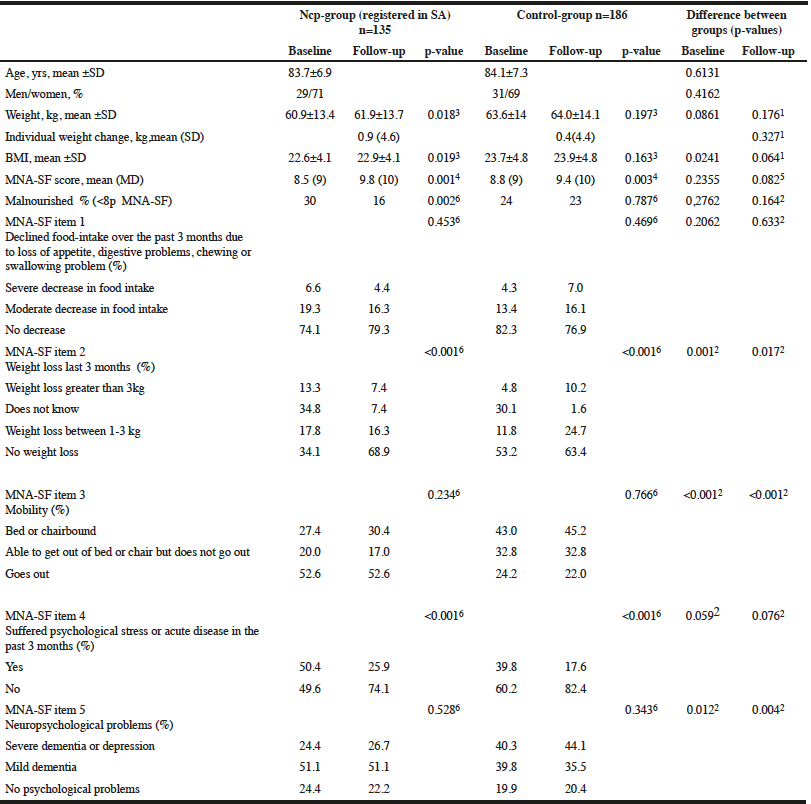
Table 1
Description of the participants in the two groups at baseline and follow-up
MNA-SF= short form of the Mini Nutritional Assessment; 1. T-test; 2. chi-squared test; 3. paired T-test; 4. Wilcoxon paired test; 5. Mann-Whitney test; 6. McNemar’s test.
Intervention
The intervention followed the standardized and structured preventive care programme, including individualized nutrition actions, of the SA registry. The selection of assessment scales, determination of underlying causes and actions suggested by SA were established empirically by an expert group vouching for use of an evidence-based method. The workflow can be described in four steps: (1) Nutritional risk assessment using the MNA-SF. (2) If the person is at risk, the underlying causes should be analysed. This analysis is based on 18 factors such as decreased chewing efficiency, loss of appetite or changes in taste and smell. (3) Planning and executing suitable nutritional actions: There are 28 predetermined actions which are divided into six groups. The most common actions in each group are listed in the Results section (Table 2). (4) Follow-up and evaluation of performed actions. Steps 2, 3 and 4 are intended to be team-based, where different professionals co-operate at regularly held team meetings. The process is iterative.
Measurements
Body weight, body mass index (BMI) and MNA-SF scores were followed for both groups. Weight was measured with scales located at each nursing home ward. For some analyses, the BMI values were divided into two groups with a cut-off at 22. In Sweden this cut-off value is recommended for use in persons over 70 years (27). As a consequence, persons with a score below 22 were considered underweight, and persons with BMI ≥22 were considered to have normal weight or to be overweight.
Risk for malnutrition was assessed using the MNA-SF, which is a six-question short form of the MNA (27). Validation has shown that the short form of the questionnaire can be used as a stand-alone questionnaire (28-30). The MNA-SF covers the past 3 months and addresses food intake, estimated weight loss, mobility, acute diseases or psychological stress, neuropsychological impairment, and BMI. The maximum possible MNA-SF score is 14 points. A score of 7 points or less indicates malnutrition and 8–11 indicates risk of malnutrition, while 12–14 points indicate no risk for malnutrition (31).
Statistical analyses
Between-groups measures were tested with chi-square, independent samples T-test or Mann-Whitney U-test depending on scale level. For the within-group analyses, paired T-test, Wilcoxon or McNemar’s test was used (Table 1). Analyses were performed using the SPSS statistical software (IBM SPSS version 20; IBM Corp., Armonk, NY, USA). P-values ≤0.05 were considered statistically significant.
Results
This study included a total of 321 residents, 135 in the ncp-group and 186 in the control-group. Both groups were selected from larger nursing home populations where the risk prevalence for malnutrition was around 60%, according to MNA-SF scores (Figure 1). Age and sex distributions were similar in both groups. At baseline, no statistical differences were seen between the groups regarding body weight, the total MNA-SF score, or how the groups were categorized into “risk of malnutrition” or “malnourished”. Body mass index, however, was significantly lower in the ncp-group. Even if the total scores of MNA-SF did not statistically differ between the groups at baseline, the ingoing items showed statistical differences regarding weight-loss, mobility and neuropsychological problems (Table 1).
A median of 4 nutritional actions were performed in the ncp-group (Q1:3, Q3:7). The majority (52% N=70) received 1-4 actions, and 42% (N=57) received 5-10 actions. In 6% more than 10 actions were performed (N=8). The most common actions were “Snack” provided to 56.3%, followed by “Decrease the duration of night time fasting”, provided to 53.3% and “Weigh control” provided to 48.9 %. One or several adjustments in the environment were combined in the variable “Adjust the environment” where at least one such variable were provided to 41.5% (Table 2).
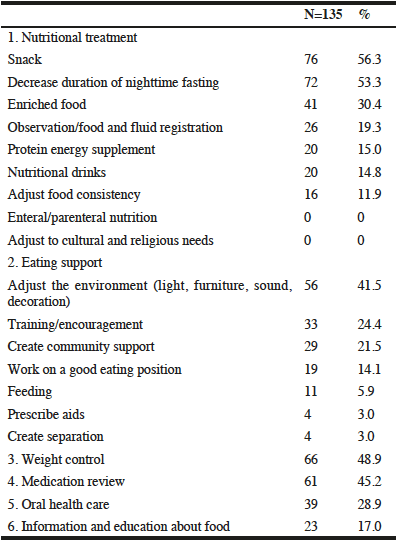
Table 2
Number of persons (%) in the ncp-group receiving different nutritional actions. A median of four nutritional actions per person were provided
Table 1 also describes the participants in the two groups at follow-up. The ncp-group had a mean start weight of 60.9 kg (SD 13.4 kg) and a mean follow-up weight of 61.9 (SD 13.7 kg) which was a statistically significant increase (t=-1.73, P=0.018; 95% CI 0.16–1.7). The control-group had a mean start weight of 63.6 kg (SD 13.8 kg) and a mean follow-up weight of 64.0 kg (SD 14.1 kg), a non-significant weight gain (t=-1.30, P=0.197; CI -1.06–0.22). The weight change was calculated individually for each participant. Comparison between the groups showed no statistically significant difference at follow-up regarding weight change (t=0.98, P=0.327; CI -0.51–1.50).
The median of MNA-SF scores in both groups increased from 9 to 10 between baseline and follow-up. This improvement was statistically significant in both groups but no statistically significant difference was shown between the groups. In the ncp-group, the size of the group categorized as malnourished decreased significantly, from 30% to 16% (Table 1).
There were significant improvements in both groups concerning the MNA-items “weight loss last 3 months” and “Suffered psychological stress or acute disease in the past 3 months”.
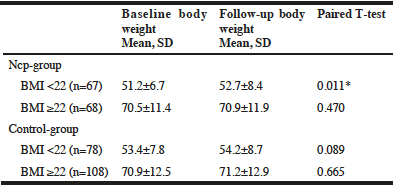
Table 3
Changes in body weight within body mass index (BMI) groups
Discussion
In this study two nursing home populations were compared regarding nutritional status at baseline and after 5–7 months. This time span was chosen based on the follow-ups for the control-group. The ncp-group was registered in the SA quality register and were thereby targeted with a preventive intervention including assessment and individually provided nutrition actions. The control-group was not included in the SA and received “care as usual”. The ncp-group showed statistically improved within-group values for body weight, foremost among those with BMI <22, indicating that the residents in most need were targeted (Table 3). Improvement was also reflected in the changed distribution between those classified as malnourished, as there was a significant decrease in the size of the malnourished group. This may indicate that using a multifaceted approach based on individual needs may have a positive effect. However, we cannot disregard the fact that the increased weight for those with lowest BMI was an effect of regression towards the mean.
Although the MNA is a well-validated tool for nutritional assessment, some studies have reported that it may actually over-represent the number of subjects at risk of malnutrition among older people living in nursing homes (18, 32). Therefore, more information about nutritional indicators may be needed. In this study many residents in the ncp-group were provided with environmental adjustments, medical reviews, weight control and observation of food intake, indicating that SA supports an overall view in the nursing home.
No statistically significant difference was shown between the groups at follow-up regarding individual weight change, BMI and MNA-score which may suggest that “care as usual”, also provides nutritional actions. In the present study, “care as usual” was not defined, which may be a shortcoming, but we know at least that the ordinary care did not include any special routines or projects aiming to improve nutritional status. A potential bias may be that malnutrition has been widely discussed in elderly care in Sweden over the last decade, which may have influenced nursing home staff in general to be more observant of signs of malnutrition. Use of inappropriate drugs among older persons is another example of an issue that has been in focus during the last decade. Therefore, providing snacks, protein energy drinks and evening meals, as well as medical reviews, are examples of actions that may have been performed in any nursing home, irrespective of SA registration or not, because of the increased attention and knowledge of staff. The SA registry has documented these actions and therefore made them visible.
From a clinical point of view, it may be argued that the result can be regarded as a positive outcome as also the residents in the control-group were able to maintain weight and had increased MNA-SF scores at follow-up. If frail older people in nursing homes can increase or at least maintain their weight, this may be a reflection of the attention and awareness of nutritional indicators and care among the caregivers, especially since earlier intervention studies report decreased weight in control groups (14, 17, 33).
Strengths and limitations
Data collected from the SA registry were clinical empirical data and therefore reflect the clinical reality. Another strength is that the SA registry is well known in clinical settings. However, it is important to consider that persons with different qualifications assessed and collected data for SA as well as entered the data into the registry, which may jeopardize quality and comparability (34). In Sweden, quality registers are very important for evaluating and improving health care, and registry data are expected to be used for research purposes (35). By using registry data, we can reveal any possible shortcomings in data quality and hopefully improve on them. However, SA was developed with the primary aim to support a process, rather than to be used for research. Characteristic variables such as diagnoses, pharmaceutical treatment, and admission date are therefore not included in the registry, but maybe needed to be included in the future.
Studies using a quasi-experimental design may have problems with incomparable groups at baseline (36). In this study the ncp-group had statistically lower BMI compared with the control-group at baseline and they also seemed to have lost more weight the past three months. A possible explanation for this may be that a larger part of the participants in the ncp-group had been more recently admitted to the nursing homes compared with participants from the control-group. It is known that older persons newly admitted to nursing homes are in poor condition as they often arrive from non-functional living conditions (19). Another possible explanation why the groups differed may be the process in how the older persons were collected to each group. Participating in a research study, like SHADES, may not mean the same as being registered in a quality registry, as the threshold to participate in a research study may be higher and potentially include ‘healthier’ persons. On the other hand the control-group was more cognitive declined which is a major risk factor for malnutrition (37, 38) and they were also less mobile. There were of course similarities between the groups, which may be due to the fact that nursing homes in Sweden have become more uniform in the last decade, with less differentiation between housing types. This is mainly because of a stay-in-home policy which means that old frail persons in Sweden are offered home help service and home health care as long as possible. Also, both groups were assessed almost within the same time frame, where the total timespan for inclusion in the two groups was seven years, which suggest good prerequisites for comparison.
Conclusion
In this study, we explored the effectiveness of a structured care programme to prevent malnutrition among older people living in nursing homes. The within-group analyses showed improvement in weight, BMI and MNA-SF in the ncp-group, indicating potential effects of the intervention among underweighted. The within-group analyse for the control group showed improvement for MNA-SF. At follow-up no statistically significant differences in corresponding measurements were found between the groups. This may indicate that nutritional care and actions did not differ largely between the nursing homes in the two groups, but that the actions were documented in the ncp-group and thereby were made visible.
Competing interests: The authors declare that they have no competing interests.
Funding: The Swedish Research Council (521-2013-8689)
Acknowledgements: The Swedish National Graduate School for Competitive Science on Ageing and Health (SWEAH) is acknowledged.
Ethical Standards: Both the SHADES and the “Health Development in Late Life” project were approved by the Research Ethical Committee in Linköping, Sweden (M150-07 and 2014/25, respectively).
References
1. Beck AM. Weight loss, mortality and associated potentially modifiable nutritional risk factors among nursing home residents – a Danish follow-up study. The Journal of Nutrition, Health & Aging. 2015;19(1):96-101.
2. Martone AM, Onder G, Vetrano DL, Ortolani E, Tosato M, Marzetti E, et al. Anorexia of aging: a modifiable risk factor for frailty. Nutrients. 2013;5(10):4126-33.
3. Stange I, Poeschl K, Stehle P, Sieber CC, Volkert D. Screening for malnutrition in nursing home residents: comparison of different risk markers and their association to functional impairment. The Journal of Nutrition, Health & Aging. 2013;17(4):357-63.
4. Skipper A. Agreement on defining malnutrition. JPEN Journal of parenteral and enteral nutrition. 2012;36(3):261-2.
5. Cowan DT, Roberts JD, Fitzpatrick JM, While AE, Baldwin J. Nutritional status of older people in long term care settings: current status and future directions. International Journal of Nursing Studies. 2004;41(3):225-37.
6. Hickson M. Malnutrition and ageing. Postgraduate Medical Journal. 2006;82(963):2-8.
7. Ahmed T, Haboubi N. Assessment and management of nutrition in older people and its importance to health. Clinical Interventions in Aging. 2010;5:207-16.
8. Pilgrim AL, Robinson SM, Sayer AA, Roberts HC. An overview of appetite decline in older people. Nurs Older People. 2015;27(5):29-35.
9. Volkert D. Malnutrition in older adults – urgent need for action: a plea for improving the nutritional situation of older adults. Gerontology. 2013;59(4):328-33.
10. Verbrugghe M, Beeckman D, Van Hecke A, Vanderwee K, Van Herck K, Clays E, et al. Malnutrition and associated factors in nursing home residents: a cross-sectional, multi-centre study. Clinical Nutrition (Edinburgh, Scotland). 2013;32(3):438-43.
11. Diekmann R, Winning K, Uter W, Kaiser MJ, Sieber CC, Volkert D, et al. Screening for malnutrition among nursing home residents — a comparative analysis of the Mini Nutritional Assessment, the Nutritional Risk Screening, and the Malnutrition Universal Screening Tool. The Journal of Nutrition, Health & Aging. 2013;17(4):326-31.
12. Törmä J, Winblad U, Cederholm T, Saletti A. Does undernutrition still prevail among nursing home residents? Clinical Nutrition (Edinburgh, Scotland). 2013;32(4):562-8.
13. Van Damme N, Buijck B, Van Hecke A, Verhaeghe S, Goossens E, Beeckman D. Development of a Quality of Meals and Meal Service Set of Indicators for Residential Facilities for Elderly. The Journal of Nutrition, Health & Aging. 2016;20(5):471-7.
14. Lee LC, Tsai AC, Wang JY. Need-based intervention is an effective strategy for improving the nutritional status of older people living in a nursing home: A randomized controlled trial. International Journal of Nursing Studies. 2013;50.
15. Stange I, Bartramb M, Liao YB, Poeschl K, Kolpatzik S, Uter W. Effects of a Low-Volume, Nutrient- and Energy-Dense Oral Nutritional Supplement on Nutritional and Functional Status: A Randomized, Controlled Trial in Nursing Home Residents. JAMDA. 2012;14.
16. Leslie WS, Woodward M, Lean ME, Theobald H, Watson L, Hankey CR. Improving the dietary intake of under nourished older people in residential care homes using an energy-enriching food approach: a cluster randomised controlled study. Journal of human nutrition and dietetics : the official journal of the British Dietetic Association. 2013;26(4):387-94.
17. Manders M, de Groot CPGM, Blauw YH, Dhonukshe-Rutten RAM, van Hoeckel-Prüst L, Bindels JG, et al. Effect of a nutrient-enriched drink on dietary intake and nutritional status in institutionalised elderly. European Journal of Clinical Nutrition. 2009;63(10):1276-.
18. Smoliner C, Norman K, Scheufele R, Hartig W, Pirlich M, Lochs H. Effects of food fortification on nutritional and functional status in frail elderly nursing home residents at risk of malnutrition. Nutrition. 2008;24.
19. Wikby K, Ek AC, Christensson L. Implementation of a nutritional programme in elderly people admitted to resident homes. Scandinavian Journal of Caring sciences. 2009;23(3):421-30.
20. Johansson L, Wijk H, Christensson L. Improving nutritional status of older persons with dementia using a national preventive care program. The Journal of Nutrition, Health & Aging. 2016:1-7.
21. Government offices of Sweden. Fyra år med fokus på de mest sjuka äldre. [Swedish], The investment of older persons: Four years focusing on the severe ill. Regeringskansliet: Elanders: 2014.
22. Ministry of Health and Social Affairs. [Swedish] Satsningen de mest sjuka äldre. Available from: http://www.regeringen.se/sb/d/14622/a/164150. Accessed 2016-10-11.
23. Edvinsson J, Rahm M, Trinks A, Höglund PJ. Senior alert: a quality registry to support a standardized, structured, and systematic preventive care process for older adults. Quality Management in Health Care. 2015;24(2):96-101.
24. Lichtenstein P, Sullivan PF, Cnattingius S, Gatz M, Johansson S, Carlstrom E, et al. The Swedish Twin Registry in the third millennium: an update. Twin Research and Human Genetics : the official journal of the International Society for Twin Studies. 2006;9(6):875-82.
25. Lannering C, Ernsth Bravell M, Midlöv P, Östgren CJ, Mölstad S. Factors related to falls, weight-loss and pressure ulcers – more insight in risk assessment among nursing home residents. Journal of Clinical Nursing. 2016.
26. Ernsth Bravell M, Westerlind B, Midlöv P, Östgren CJ, Borgquist L, Lannering C, et al. How to assess frailty and the need for care? Report from the Study of Health and Drugs in the Elderly (SHADES) in community dwellings in Sweden. Archives of Gerontology and Geriatrics. 2011;53(1):40-5.
27. Swedish National Food Administration. [Swedish] Available from: http://www.livsmedelsverket.se/matvanor-halsa–miljo/sjukdomar-allergier-och-halsa/overvikt-och-fetma/. Accessed 2016-12-05.
28. Rubenstein LZ, Harker JO, Salva A, Guigoz Y, Vellas B. Screening for undernutrition in geriatric practice: developing the short-form mini-nutritional assessment (MNA-SF). The Journals of Gerontology Series A, Biological sciences and medical sciences. 2001;56(6):M366-72.
29. Wikby K, Ek AC, Christensson L. The two-step Mini Nutritional Assessment procedure in community resident homes. Journal of Clinical Nursing. 2008;17(9):1211-8.
30. Kaiser MJ, Bauer JM, Uter W, Donini LM, Stange I, Volkert D, et al. Prospective validation of the modified mini nutritional assessment short-forms in the community, nursing home, and rehabilitation setting. Journal of the American Geriatrics Society. 2011;59(11):2124-8.
31. Kaiser MJ, Bauer JM, Ramsch C, Uter W, Guigoz Y, Cederholm T, et al. Validation of the Mini Nutritional Assessment short-form (MNA-SF): a practical tool for identification of nutritional status. The Journal of Nutrition, Health & Aging. 2009;13(9):782-8.
32. Beck AM, Holst M, Rasmussen HH. Efficacy of the Mini Nutritional Assessment to predict the risk of developing malnutrition or adverse health outcomes for old people. e-SPEN, the European e-Journal of Clinical Nutrition and Metabolism. 2008;3(3):e102-e7.
33. Lorefält B, Andersson A, Wirehn AB, Wilhelmsson S. Nutritional status and health care costs for the elderly living in municipal residential homes – an intervention study. The Journal of Nutrition, Health & Aging. 2011;15(2):92-7.
34. Johansson L, Wijk H, Christensson L. Health Care Professionals’ Usage and Documentation of a Swedish Quality Registry Regarding Preventive Nutritional Care. Quality management in health care. 2017;26(1):15-21.
35. Emilsson L, Lindahl B, Koster M, Lambe M, Ludvigsson JF. Review of 103 Swedish Healthcare Quality Registries. Journal of Internal Medicine. 2015;277(1):94-136.
36. Kazdin AE. Research Design in Clinical Psychology. Boston, MA: Allyn and Bacon; 2003.
37. Fagerström, C., Palmqvist, R., Carlsson, J. & Hellström, Y. (2011) Malnutrition and cognitive impairment among people 60 years of age and above living in regular housing and in special housing in Sweden: a population-based cohort study. Int J Nurs Stud, 48, 863-871.
38. Tamura BK, Bell CL, Masaki KH, Amella EJ. Factors associated with weight loss, low BMI, and malnutrition among nursing home patients: a systematic review of the literature. Journal of the American Medical Directors Association. 2013;14(9):649-55.